The Number of Humans on Earth
 Consider the number of human beings on the surface of the earth; the population of the world. Reasonably researched data exists for this number over the course of several thousand years. And accurate data exists for most of the last 110 years – often year by year.
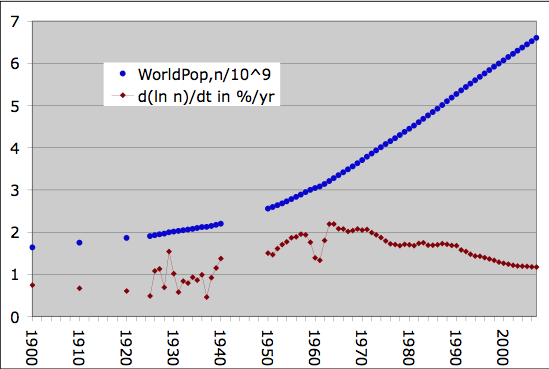
I’ve plotted some of the data in the graph.
The horizontal axis covers the years from 1900 to 2007. Where data was available, the blue points display the estimated number of people in the world in billions. (The number 4 on the vertical axis means a population of 4 billion people)
The red points represent the percentage increase in population per year as calculated from the blue population data. For the red data the numbers on the vertical axis mark the population increase in percentage points per year. (The same number 4 means, for this curve, a growth rate of 4%/year)
From data not plotted here it is clear that before 1900 the growth rate was always lower than 0.7%/yr and usually significantly lower. At the time of the Bubonic Plague in 1400 the human population growth rate was negative. In 1798, when Malthus published “On Population” the growth rate was about 0.4 %/year.
So we see from the graph that the greatest percentage growth rate in the recorded history of humanity happened between the years 1963 and 1972! And that was about 2%/yr – a doubling time of 35 years.
The dip in the curve around 1960 is due entirely to the population drop of 10 million people in China. This was the time of the great famine caused by Mao Tse Dung’s “Great Leap Forward”.
Where do the numbers come from?
Happily google offers us a table of data gathered from many sources called Appendix: World Population Estimate Sets : 10,000 B.C. to 2007 A.D.. I don’t know to what this is an appendix but the offering is a precious one. All the sources are referenced for each entry in the table.
Another site for world population data where the references are provided is the table called Historical Estimates of World Population offered by the U.S. Census Bureau. My 1910 estimate comes from this site; the google one lacks this date.
Something called the HYDE database (History Database of the Global Environment) developed under the authority of the Netherlands Environmental Assessment Agency, is available at
http://www.pbl.nl/en/themasites/hyde/index.html
Unfortunately this site is not at all user-friendly. Getting data from this site is possible but painful.
The chain of yearly data between 1925 and 1939 comes from the published Yearbooks of the League of Nations. The chain of data from 1950 to the present comes from a table called “Total Midyear Population for the World: 1950-2050” offered as part of the U.S. Census Bureau’s International Data Base
Comments
2 responses to “Number of Humans”
This is fascinating! What an astonishing thing it is to see that blue curve and to have the rate conveniently placed inline. Thanks for posting this!
You are very lucid in your presentation. Until the growth rate turns negative we continue to be at risk from over population whatever that risk may be. what are the benefits of increasing the population?